
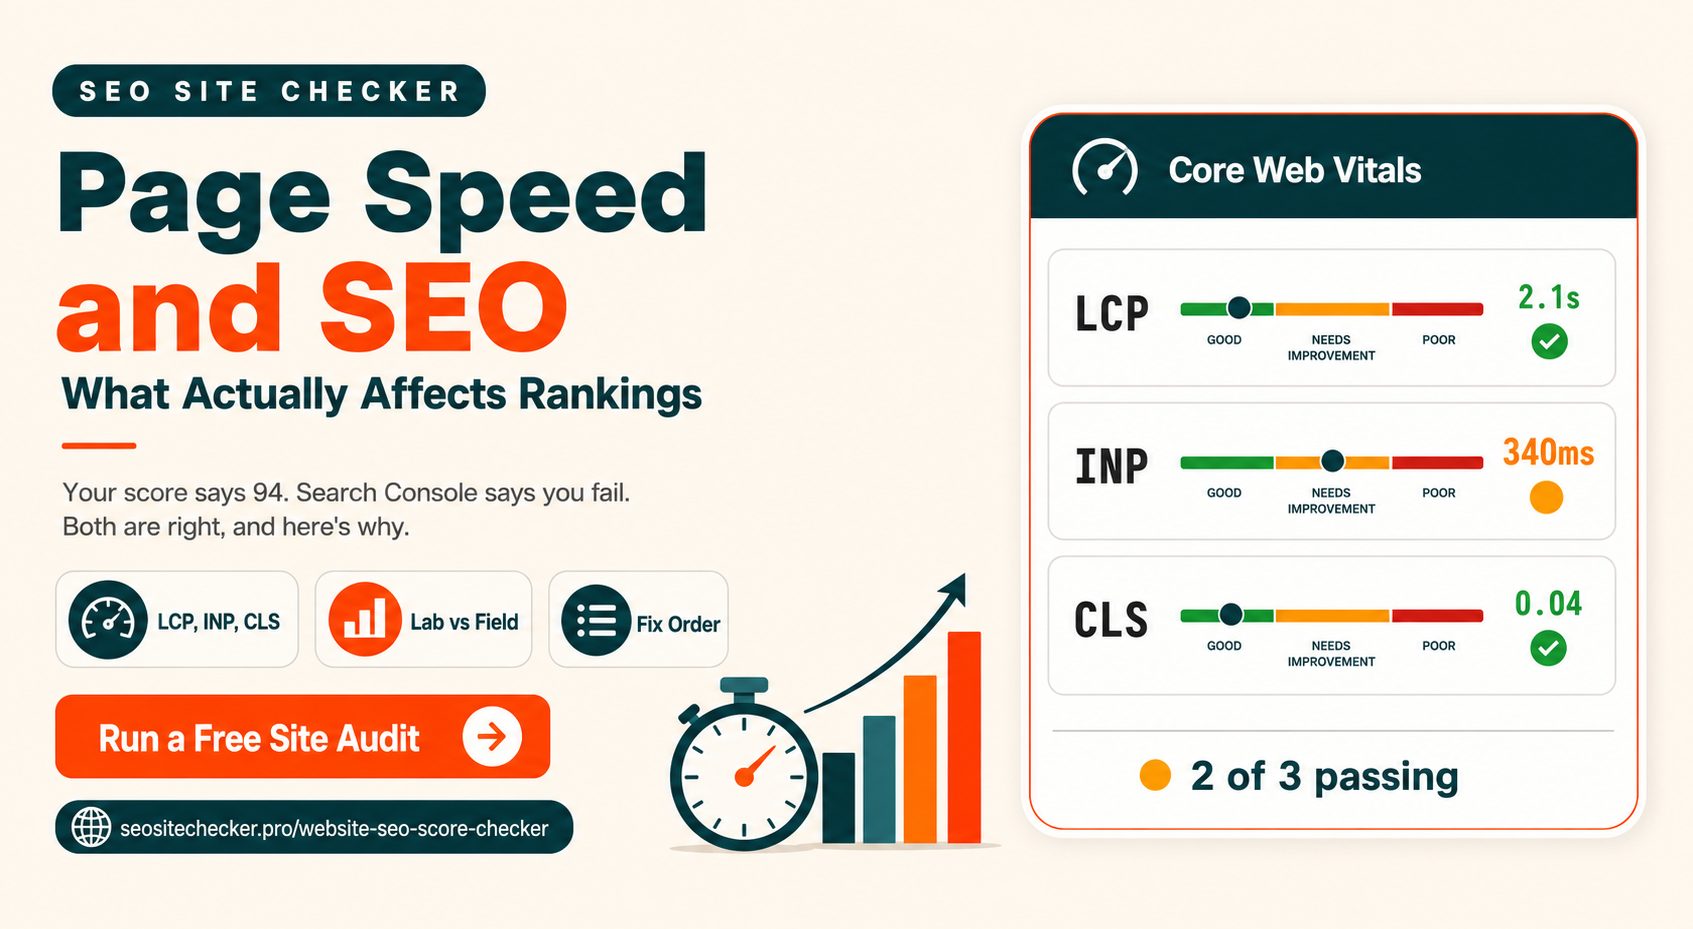
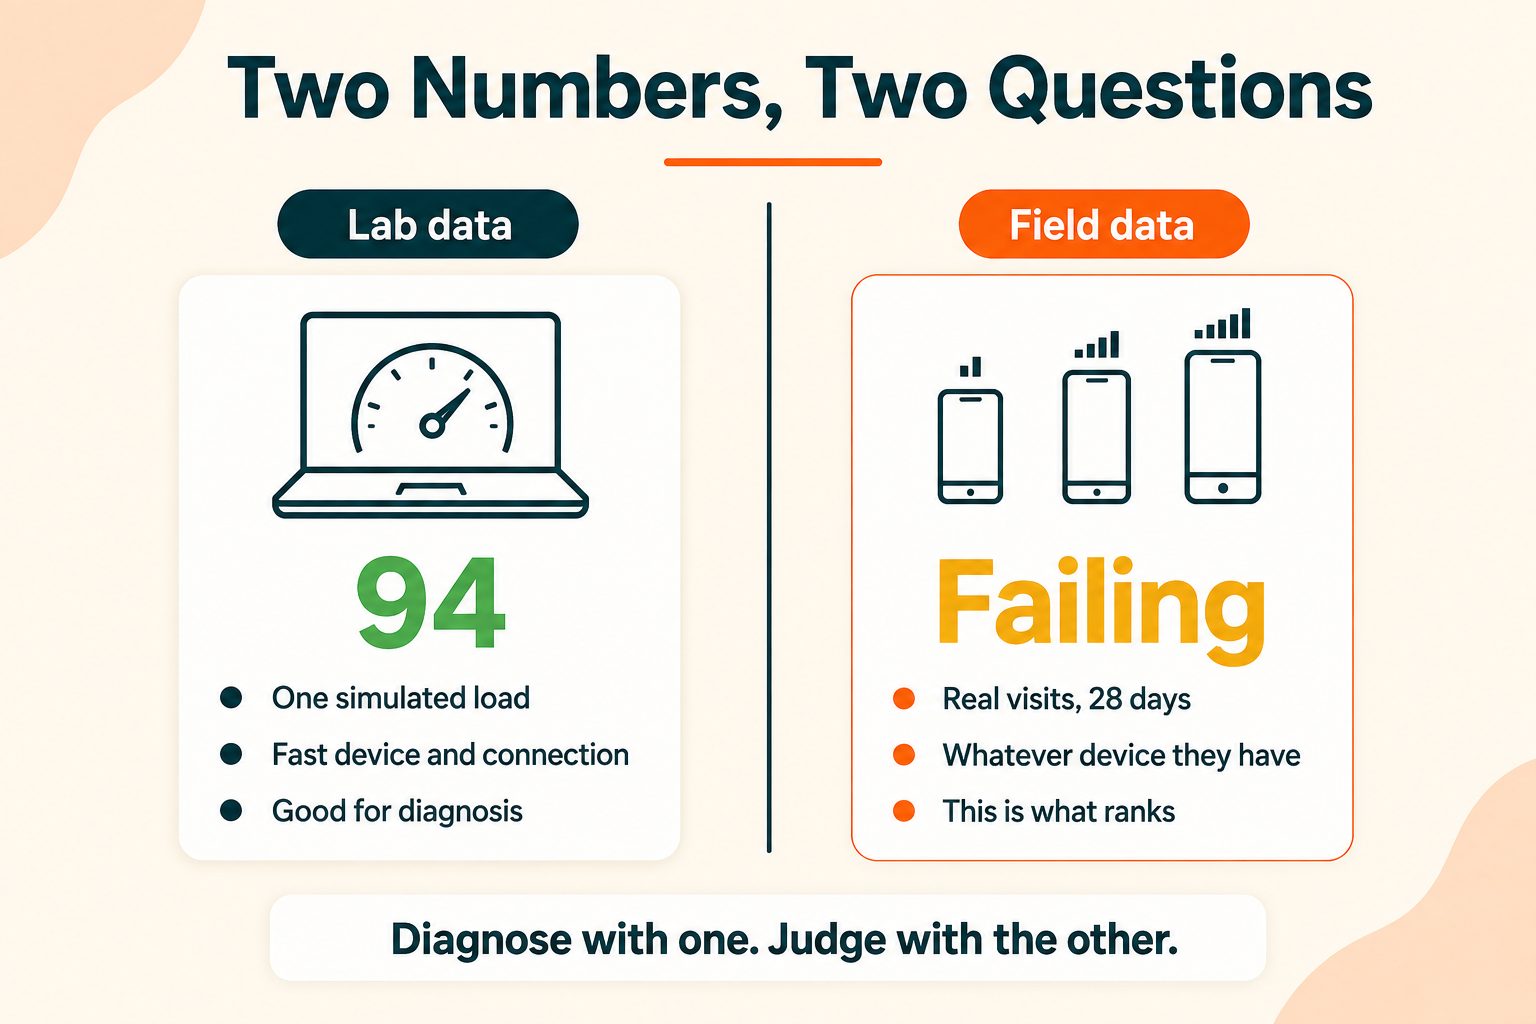
Your PageSpeed Insights score says 94. Search Console says your Core Web Vitals are failing. You refresh both. Nothing changes.
Both numbers are correct. They are measuring different things, on different devices, for different people, and once you understand that difference most of the confusion around page speed SEO disappears.
This guide covers what page speed means in practical terms, the three metrics Google actually ranks on, how much speed really affects your position, why lab tests and field data disagree, and what to fix in what order. There is a lot of recycled advice on this topic, so where the honest answer is "less than you have been told," that is what you will get.
What Is Page Speed and Why It Affects SEO
Page speed is how quickly a page loads for a visitor. Simple enough as a definition, and almost useless as a measurement, because there is no single moment when a page is finished loading.
That is why several different numbers exist:
Time to First Byte (TTFB). How long before your server responds at all. If you have ever stared at a white screen for two seconds, that was TTFB.
First Contentful Paint (FCP). When the first piece of content appears, even if it is just a heading.
Largest Contentful Paint (LCP). When the main content becomes visible. Usually your hero image or headline block.
Fully loaded. When every last resource has finished downloading.
Worth knowing straight away: Google does not use fully loaded time, and has not for years. Optimising that number is one of the more common ways people waste an afternoon.
The connection to SEO runs along two paths, and most articles get the relative sizes backwards.
The direct path. Google has used speed as a ranking signal since 2010. Since June 2021 the specific mechanism has been the page experience signal, built on the Core Web Vitals.
The indirect path, which is bigger. Slow pages get abandoned before anyone reads them. That affects engagement, conversions, and every behavioural signal around your ranking. It also affects revenue directly, on traffic you already earned. The direct ranking effect is real but modest. The indirect effect is where the money is.
Page Speed vs Core Web Vitals
These get used interchangeably and they are not the same thing.
Page speed is the general concept. Any measurement of how fast a page loads counts.
Core Web Vitals are three specific metrics that Google selected, set thresholds for, and measures using data from real visitors. They are what actually feeds the ranking signal.
The practical consequence matters. You can genuinely improve "page speed" and still fail Core Web Vitals, because you improved something Google is not measuring. Shaving two seconds off fully-loaded time while your LCP element is still a slow, oversized hero image is exactly this mistake, and it is common.
One more distinction worth settling. Page speed is one page. Site speed is an aggregate across many pages. Google evaluates Core Web Vitals at the page level, then groups similar URLs together when there is not enough field data for an individual page. That grouping catches people out, because one slow template can drag an entire section of your site into a failing group.
The Three Core Web Vitals, Explained
Largest Contentful Paint (LCP)
Measures how long until the largest visible element in the viewport finishes rendering. Usually a hero image, a video poster frame, or a large heading block.
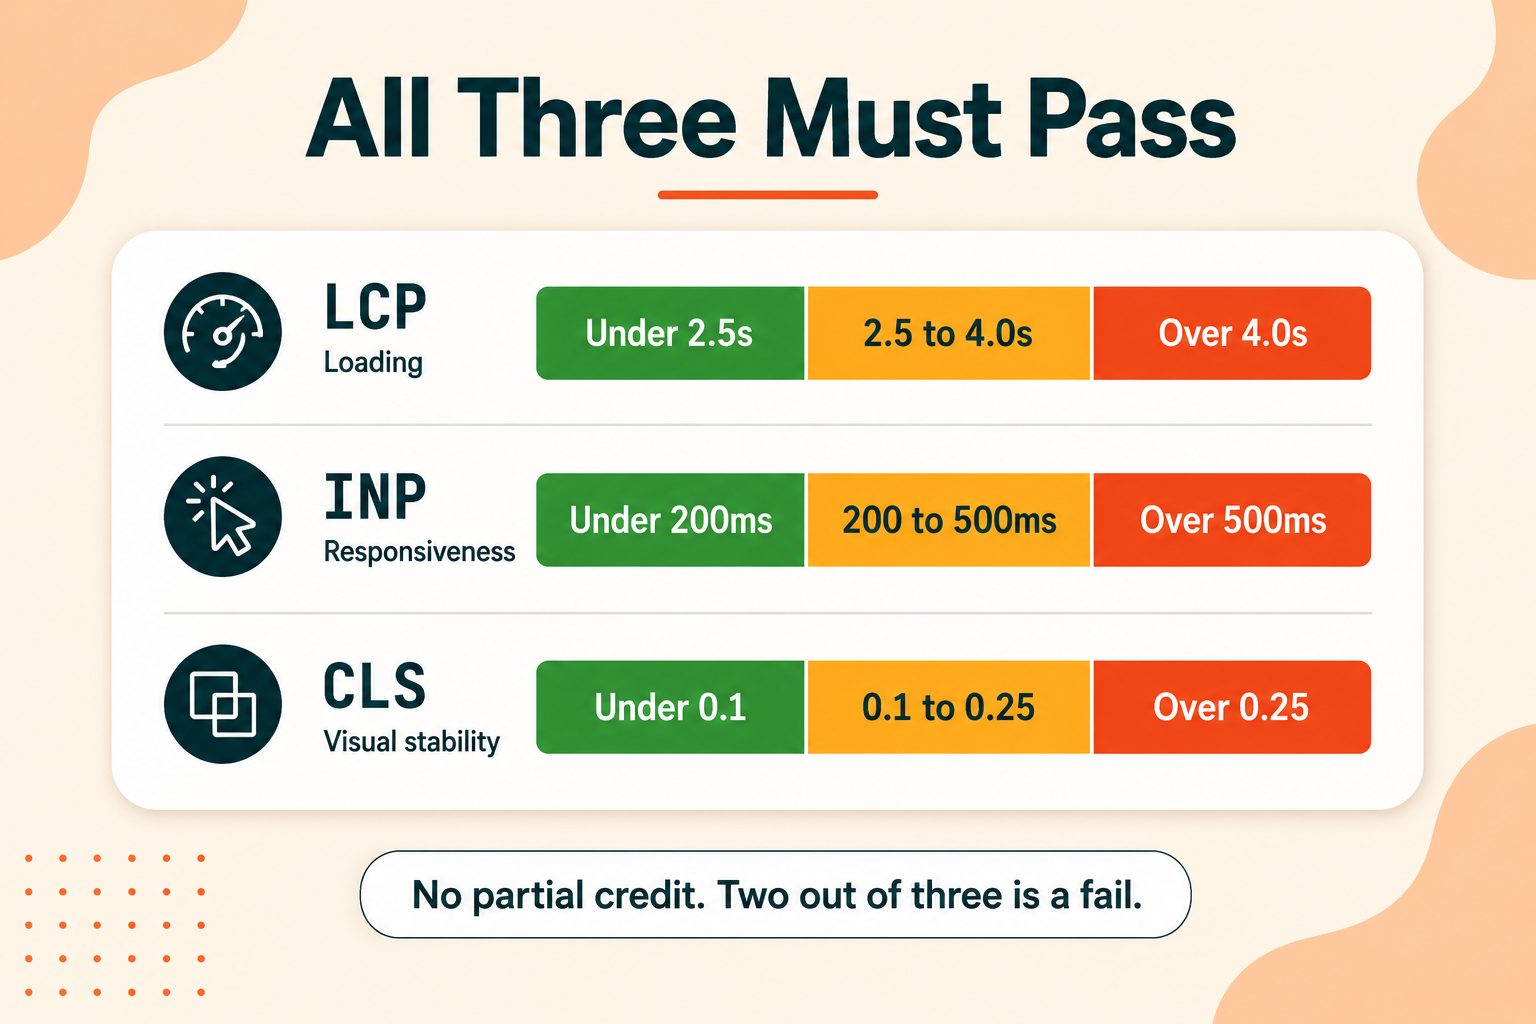
Good: under 2.5 seconds. Needs improvement: 2.5 to 4.0 seconds. Poor: over 4.0 seconds.
What typically causes a bad LCP: slow server response, render-blocking CSS or JavaScript, large unoptimised images, and client-side rendering that delays the main content from appearing at all.
LCP is the metric most sites still fail. It is also usually the most fixable, because the causes are concrete and the fixes are well understood.
Interaction to Next Paint (INP)
Measures how quickly your page responds to interactions across the entire visit, not just the first one. It replaced First Input Delay in March 2024, and the change matters: FID only looked at the first interaction, which flattered sites that got slow after loading.
Good: under 200 milliseconds. Needs improvement: 200 to 500 milliseconds. Poor: over 500 milliseconds.
What it feels like to a user: you tap a button and nothing happens for a beat. The page has loaded, it looks ready, and it is not listening yet. That gap is INP.
Be realistic about this one. INP is the hardest of the three to fix, because the cause is almost always JavaScript occupying the main thread, and the fix is architectural rather than a setting you toggle. No caching plugin fixes INP. If you are failing it, you are looking at reducing or restructuring JavaScript, and that usually needs a developer.
Cumulative Layout Shift (CLS)
Measures visual stability. How much content jumps around while the page loads.
Good: under 0.1. Needs improvement: 0.1 to 0.25. Poor: over 0.25.
Common causes: images without width and height attributes, ads or embeds injected without space reserved for them, and web fonts swapping in and reflowing text.
CLS is usually the easiest of the three to fix, which makes it the sensible place to start. Adding dimensions to your images is often most of the work.
The thresholds, together
| Metric | What it measures | Good | Needs work | Poor |
|---|---|---|---|---|
| LCP | Loading | Under 2.5s | 2.5 to 4.0s | Over 4.0s |
| INP | Responsiveness | Under 200ms | 200 to 500ms | Over 500ms |
| CLS | Visual stability | Under 0.1 | 0.1 to 0.25 | Over 0.25 |
All three must pass for a page to get a good assessment. There is no partial credit, which is worth remembering when you are deciding what to fix. Google's own definition of the Core Web Vitals documents each metric in full.
Is Page Speed Actually a Ranking Factor?
Yes, and the honest version is more useful than the confident one.
It is confirmed. Core Web Vitals form part of Google's page experience signals and have done since June 2021.
But it is a tiebreaker, not a trump card. Google has been consistent that page experience does not override relevance. A fast page about the wrong thing will not outrank a slow page that answers the query properly. Google Search Central's page experience documentation says as much directly.
Where it actually matters:
- If your content is weaker than the competition, speed will not rescue you
- If your content is comparable, speed can decide which of you ranks higher
- If your Core Web Vitals sit in the "poor" band, you are giving away ground you did not need to give away
In a competitive niche where several pages answer the query equally well, "comparable" describes most of the results. That is precisely where a tiebreaker decides things.
There is one more angle competitors skip. Faster pages let Googlebot fetch more within the same crawl budget. On a small blog this is irrelevant. On a large site it affects how much of your content gets discovered and how often it gets refreshed, which is a real SEO consequence that has nothing to do with the page experience signal.
Why Your Score Says 94 and Google Says You Fail
This is the single most confusing thing about page speed, and almost nobody explains it properly.
Lab data is a simulated test. One page load, one device, one connection, under controlled conditions. That is your PageSpeed Insights score, your Lighthouse run, your local dev tools audit. It is excellent for diagnosis. It is not what Google ranks on.
Field data is real visits from real Chrome users, collected over a rolling 28-day window in the Chrome UX Report. That is what feeds the ranking signal.
And here is the part that explains everything: Google evaluates at the 75th percentile. For a page to pass a metric, at least 75 percent of real visits must hit the good threshold.
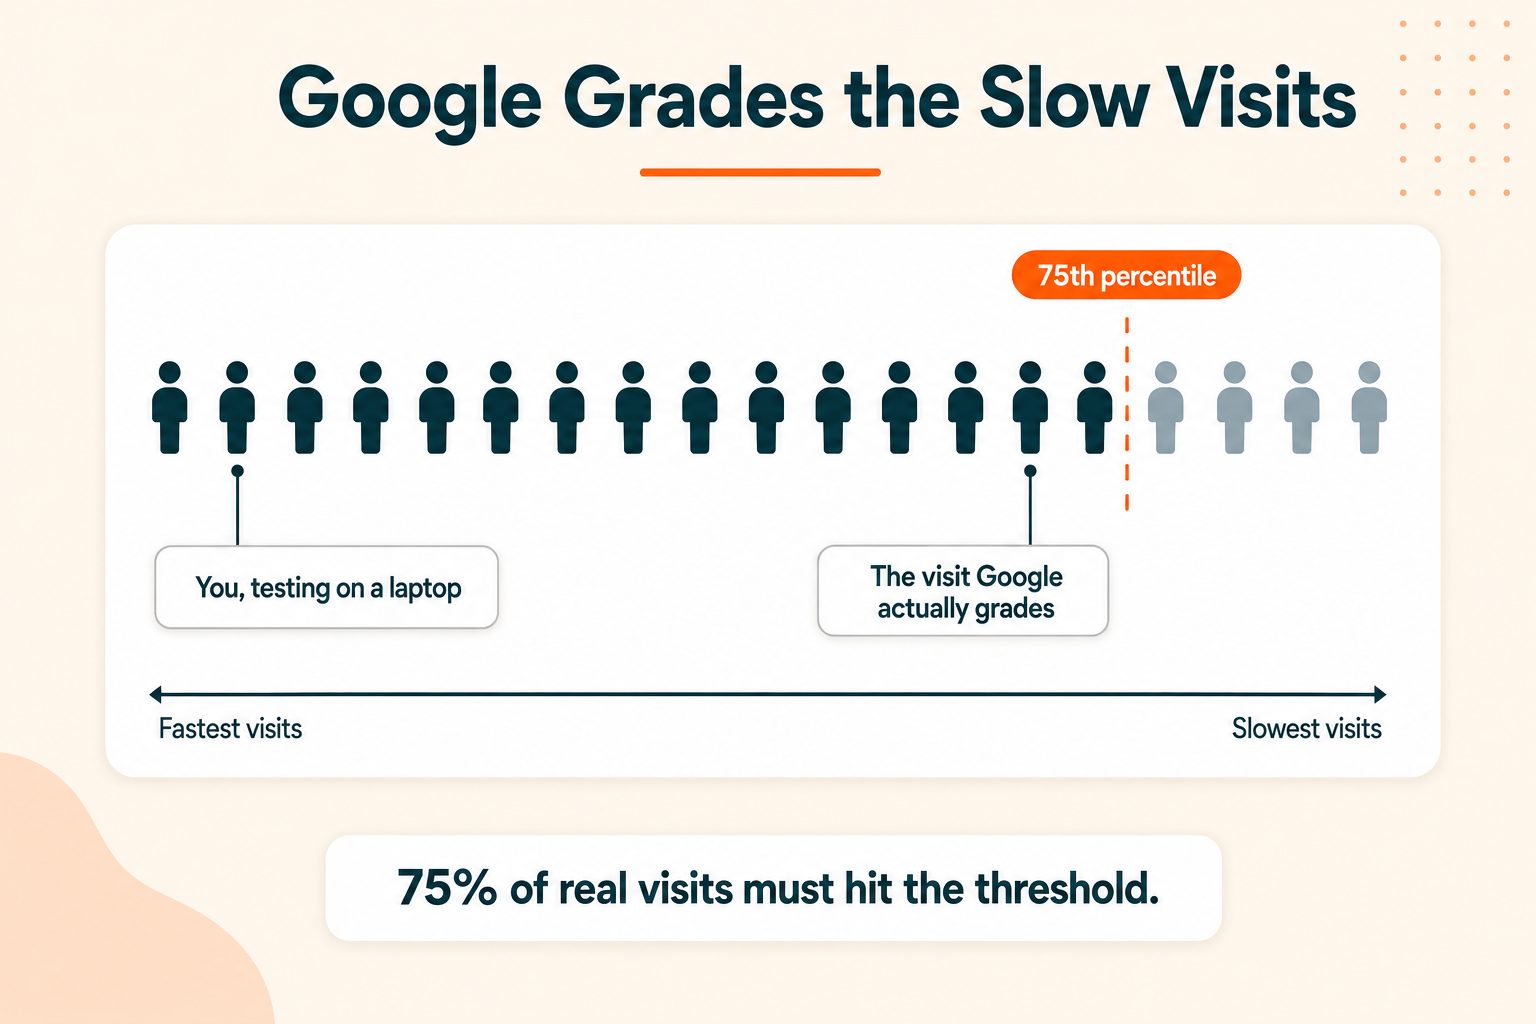
Think about what that actually means. Your test, on a fast laptop with a fibre connection and no browser extensions, is roughly a 5th percentile experience. You are one of the fastest visits your site will ever receive.
The 75th percentile is somebody on a mid-range Android phone, on patchy mobile data, in a browser with three extensions running, possibly on a train. You have to be fast for them. Not for you.
That is why a page can feel fast, score 94 in the lab, and fail in the field. Both numbers are accurate. They answer different questions. The Chrome UX Report documentation explains how the field dataset is collected and windowed.
The practical rule that follows: use lab data to find what to fix, use field data to know whether you have fixed it.
How to Measure Your Page Speed
Different tools serve different jobs, so pick based on what you are trying to learn.
To find out what is actually failing: the Core Web Vitals report in Search Console. It shows field data grouped by URL pattern, so you can see which templates or sections are the problem. This is the report that matters for rankings, and it is where you should start.
To diagnose a specific page: PageSpeed Insights. It gives you both field and lab data on one screen, plus specific recommendations. Run it on a representative URL from each failing group rather than on your homepage by default.
To debug the underlying cause: browser dev tools. The Performance panel shows you exactly what blocked rendering, when, and for how long.
To catch everything else at the same time: a broader technical audit. Page speed problems rarely travel alone, and the pages with slow load times often have other issues worth fixing in the same pass. You can run a full site audit free and work down the list.
The workflow, in order: Search Console to find failing groups, PageSpeed Insights on a representative URL from each, dev tools to diagnose the cause, then fix and wait for field data to catch up.
What Actually Slows Pages Down
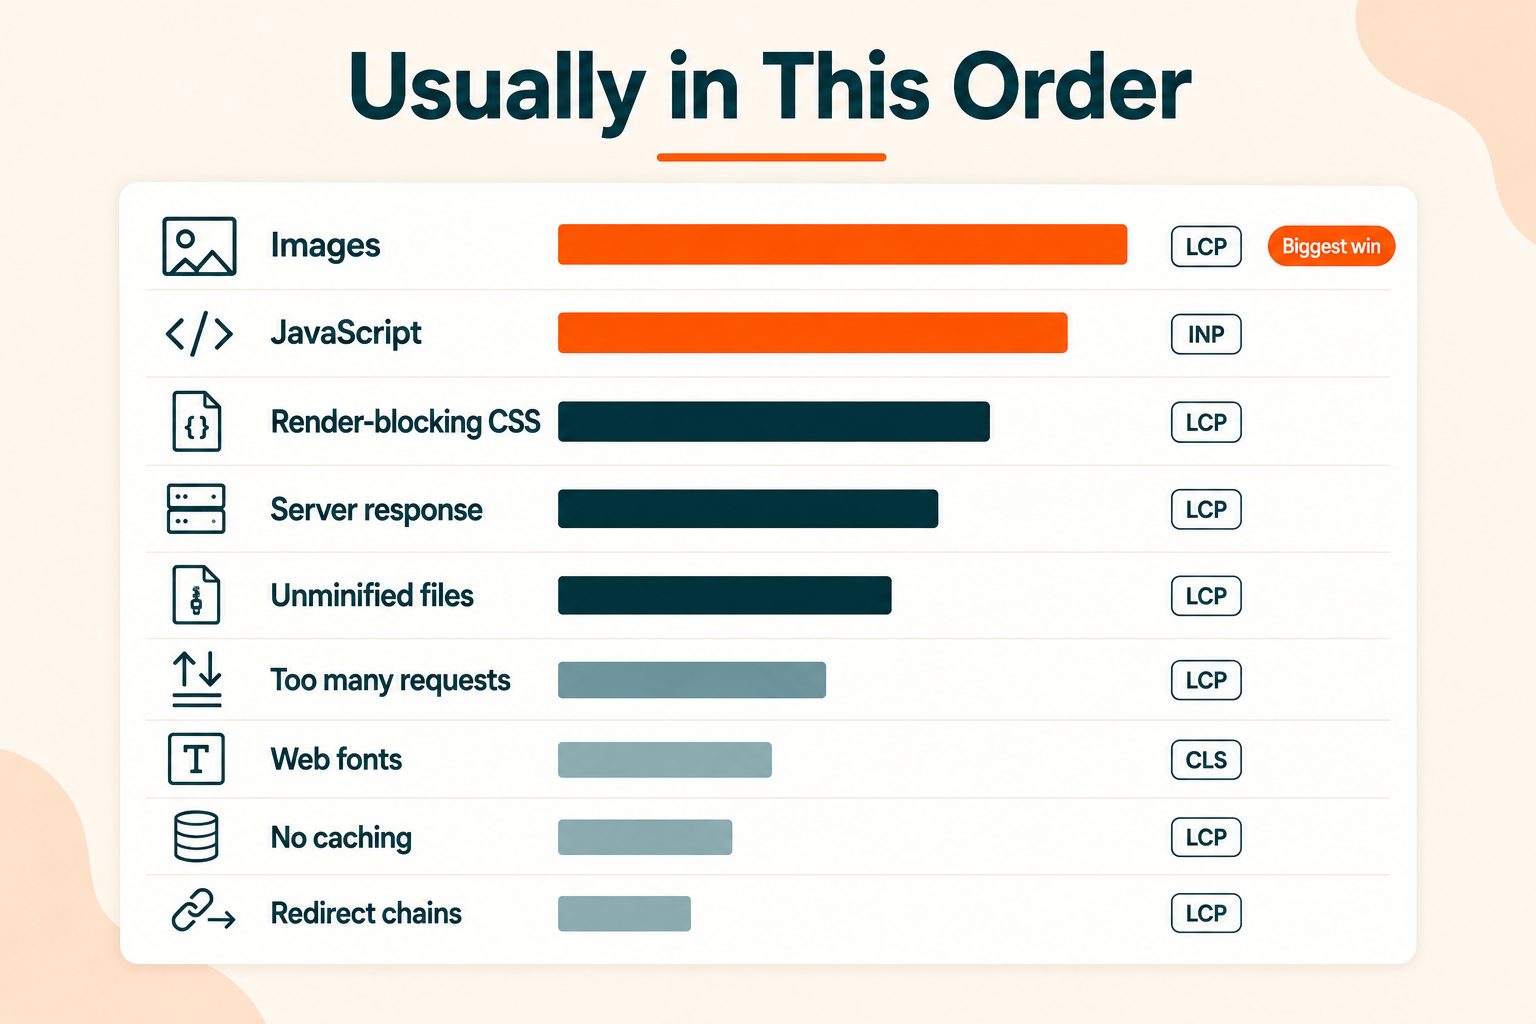
Roughly in order of how often each one turns out to be the real problem.
Images. Almost always the biggest single contributor. Wrong format, no compression, dimensions far larger than the space they display in, and no lazy loading below the fold. A 3 MB hero image is a failing LCP on its own.
JavaScript. The main cause of poor INP and a frequent contributor to bad LCP. Third-party scripts compound quickly: analytics, chat widgets, A/B testing tools, ad tags, heat mapping. Each one seems small.
Render-blocking CSS. Stylesheets in the head block rendering until they finish downloading and parsing. Nothing appears until they do.
Server response time. Slow hosting, unoptimised database queries, no server-side caching. If your TTFB is over 600 milliseconds, nothing downstream will save you. You can check your server response quickly to rule this in or out.
Unminified and uncompressed files. Extra bytes on every single request. Not usually the bottleneck, but free to fix.
Too many requests. Each one carries overhead. HTTP/2 reduced this considerably, so it matters less than it used to.
Web fonts. Two problems at once: layout shift when they swap in, and delayed text rendering while they load.
No browser caching. Repeat visitors re-download everything they already have.
Redirect chains. Every hop adds a full round trip before anything starts loading.
If you want to see exactly what your server sends rather than what your browser renders after JavaScript runs, the Online HTML Viewer shows you the raw response.
How to Improve Page Speed, in Priority Order
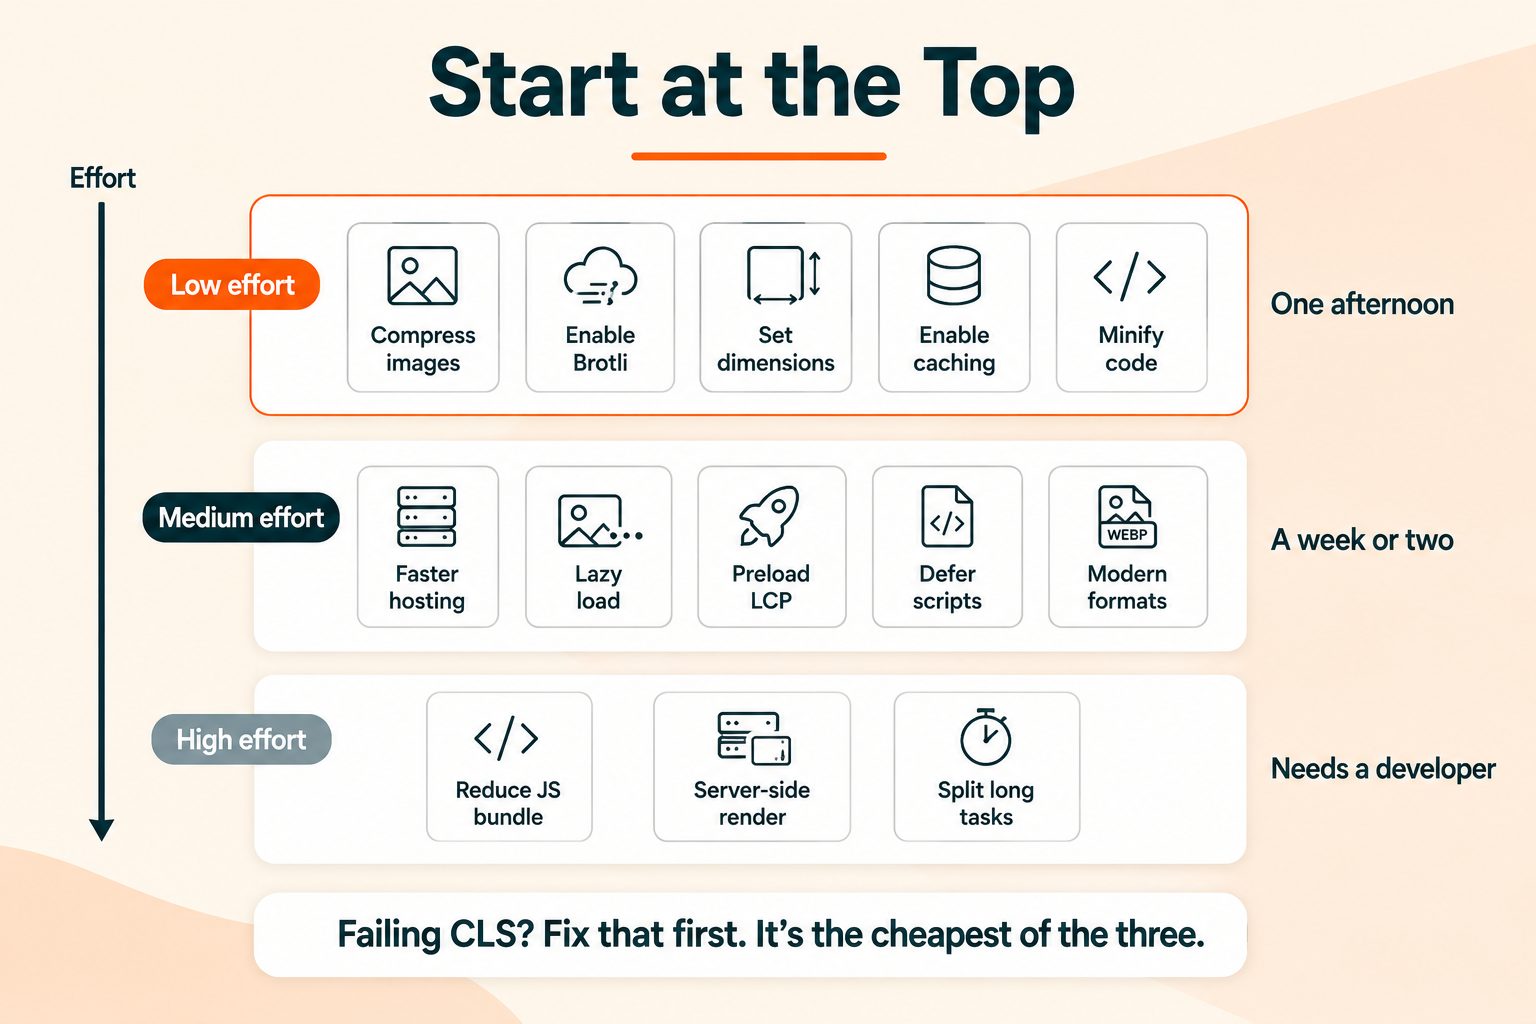
Most guides give you an unordered list of twenty things. Here is the same material sorted by what actually returns the most for the effort.
High impact, low effort
Do these first. Most site owners can complete all five in an afternoon, and together they resolve the majority of LCP and CLS failures.
- Compress and correctly size your images. The single biggest win on most sites. Compress your images and resize them to the dimensions you actually display rather than letting the browser scale down a 4000px original.
- Enable Brotli or gzip compression on your server. A configuration change that typically cuts text file transfer size by 70 to 85 percent.
- Set width and height attributes on all images and video. This alone fixes most CLS problems, because the browser reserves the space before the file arrives.
- Enable browser caching. Repeat visitors stop re-downloading assets that have not changed.
- Minify your code. Free bytes on every request. Run your files through the HTML Minifier, CSS Minifier, and JavaScript Minifier, or better, minify your HTML, CSS and JavaScript as part of your build process so it happens automatically.
High impact, medium effort
- Improve server response time. Better hosting, server-side caching, or query optimisation. If TTFB is your problem, this is not optional.
- Lazy-load below-the-fold images. Nothing offscreen should compete with your LCP element for bandwidth.
- Preload your LCP element. Tell the browser what matters most before it discovers it on its own.
- Audit and defer third-party scripts. Remove what you are not using. Defer what can wait.
- Serve modern image formats. WebP and AVIF are meaningfully smaller than JPEG at equivalent quality.
High impact, high effort
- Reduce JavaScript bundle size and split your code. Ship less, ship it later.
- Move rendering server-side where it makes sense. Client-side rendering delays LCP by design.
- Break up long tasks blocking the main thread. This is where INP problems live and it usually requires a developer.
One piece of sequencing advice that competitors miss. If you are failing CLS, fix that first, even though it feels less important than loading speed. All three metrics must pass for the page to get a good assessment, and CLS is by far the cheapest of the three to resolve. Fixing your hardest metric while an easy one still fails buys you nothing.
The Business Case Beyond SEO
You will find a lot of confident conversion statistics on this topic. Treat them carefully. Many trace back to studies over a decade old, and the numbers vary enormously by industry, device mix, and traffic source. The direction is consistent across studies. The specific percentages are not.
The mechanism is more reliable than the numbers. Slower pages mean more people leave before content appears, fewer completed actions among those who stay, and lower conversion on visits you have already paid for through advertising or earned through ranking.
That last point is the one worth acting on. Page speed improvements apply to traffic you already have. Unlike most SEO work, you do not need new rankings, new links, or new content to see a return. The visitors are already arriving. Some proportion of them are currently leaving before your page renders.
Page Speed Myths Worth Dropping
"You need a 100 score." The score is a lab diagnostic. Field data is what ranks. A perfect 100 alongside failing field data means nothing at all.
"Page speed is the biggest ranking factor." It is a tiebreaker. Relevance, content quality, and links dominate. Treating speed as the main lever produces fast pages that nobody wants to read.
"Fully loaded time is what matters." Google stopped using it. LCP is the loading metric that counts.
"A caching plugin fixes everything." Caching helps TTFB and repeat visits. It does nothing for INP, which is a JavaScript problem.
"Desktop and mobile matter equally." The thresholds were calibrated around mid-range mobile capability. Mobile is where you will fail, and mobile is what to test.
"Minification will fix a slow site." It helps and it is free. It is almost never the bottleneck, which is usually images or JavaScript.
"Speed matters more than content." It does not. Google has said so repeatedly, and every SERP demonstrates it.
Wrapping Up
The order that works:
Check field data in Search Console first, so you fix what is actually failing rather than what a lab test flagged. Use PageSpeed Insights and dev tools to find the cause. Then fix images and enable compression before anything else, because those two account for most of the problem on most sites.
Remember that all three Core Web Vitals must pass together, so start with whichever is cheapest to fix rather than whichever feels most serious.
And give it time. Field data runs on a 28-day rolling window, so a fix you deploy today will not show up in Search Console for about a month. That delay is normal, and plenty of people undo good work because they checked after a week and assumed it had not helped.
Frequently Asked Questions
Frequently Asked Questions (FAQs) is a list of common questions and answers provided to quickly address common concerns or inquiries.
Is page speed a ranking factor?
Yes. Core Web Vitals have been part of Google's page experience signals since June 2021. It works as a tiebreaker between comparable pages rather than overriding content relevance.
What is a good page speed?
Judge by the Core Web Vitals thresholds: LCP under 2.5 seconds, INP under 200 milliseconds, CLS under 0.1. All three must pass at the 75th percentile of real visits.
How does page speed affect SEO?
Directly through the page experience ranking signal, and indirectly through engagement, since slow pages get abandoned. The indirect effect is usually the larger of the two.
What is a good PageSpeed Insights score?
Above 90 is considered good, but the score is lab data. Your Search Console field data determines rankings, so treat the score as a diagnostic rather than a target.
How do I check my page speed?
Start with the Core Web Vitals report in Search Console for field data, then run PageSpeed Insights on a failing URL, then use browser dev tools to diagnose the specific cause.
What is the difference between page speed and site speed?
Page speed measures one page. Site speed averages across many. Google evaluates Core Web Vitals per page, grouping similar URLs together when individual field data is limited.
Do Core Web Vitals affect SEO?
Yes, as a confirmed ranking signal. All three metrics must pass together for a page to receive a good assessment, and there is no partial credit for passing two.
Why does my site score well but still fail Core Web Vitals?Why does my site score well but still fail Core Web Vitals?
Your test runs on a fast device and connection. Google measures real visits at the 75th percentile, which means slower phones on worse networks. Both numbers are accurate.
How long does it take to see results after improving page speed?
Field data uses a rolling 28-day window, so allow about a month before your Search Console report reflects the change. Lab scores update immediately.
Why is my website so slow?
Most often unoptimised images, followed by JavaScript, render-blocking CSS, and slow server response. Run a diagnostic before guessing, since the cause varies by site.