
Most guides on this subject will tell you LCP should be under 2.5 seconds. Very few will tell you how to find out which element your LCP actually is, or which of its four phases is the slow one.
That gap is the reason this article exists. If you already know the three metrics and your Search Console report is still red, the missing piece is diagnosis rather than definitions.
This guide covers what each metric measures precisely, how to identify the specific element or interaction causing a failure, and what to change once you know. If you want the broader question of how much page speed affects rankings and where it sits among your priorities, page speed and SEO covers that side.
What Is Core Web Vitals and How to Pass the Test
Core Web Vitals are three metrics Google selected to represent loading, responsiveness and visual stability, measured from real Chrome users and used as part of the page experience signal.
| Metric | Measures | Good | Needs work | Poor |
|---|---|---|---|---|
| LCP | Loading | Under 2.5s | 2.5 to 4.0s | Over 4.0s |
| INP | Responsiveness | Under 200ms | 200 to 500ms | Over 500ms |
| CLS | Visual stability | Under 0.1 | 0.1 to 0.25 | Over 0.25 |
Here is the pass condition, stated precisely, because most guides give a looser version:
A page passes when all three metrics fall in the good band at the 75th percentile of real visits, over a rolling 28-day window.
Every part of that sentence is a place people go wrong.
All three. There is no partial credit. Two good metrics and one in "needs improvement" is a failing assessment.
The good band. Not "needs improvement." The middle band is a fail for assessment purposes even though it sounds acceptable.
The 75th percentile. Not your average, and definitely not the test you ran on your laptop. Three quarters of real visits must hit the threshold.
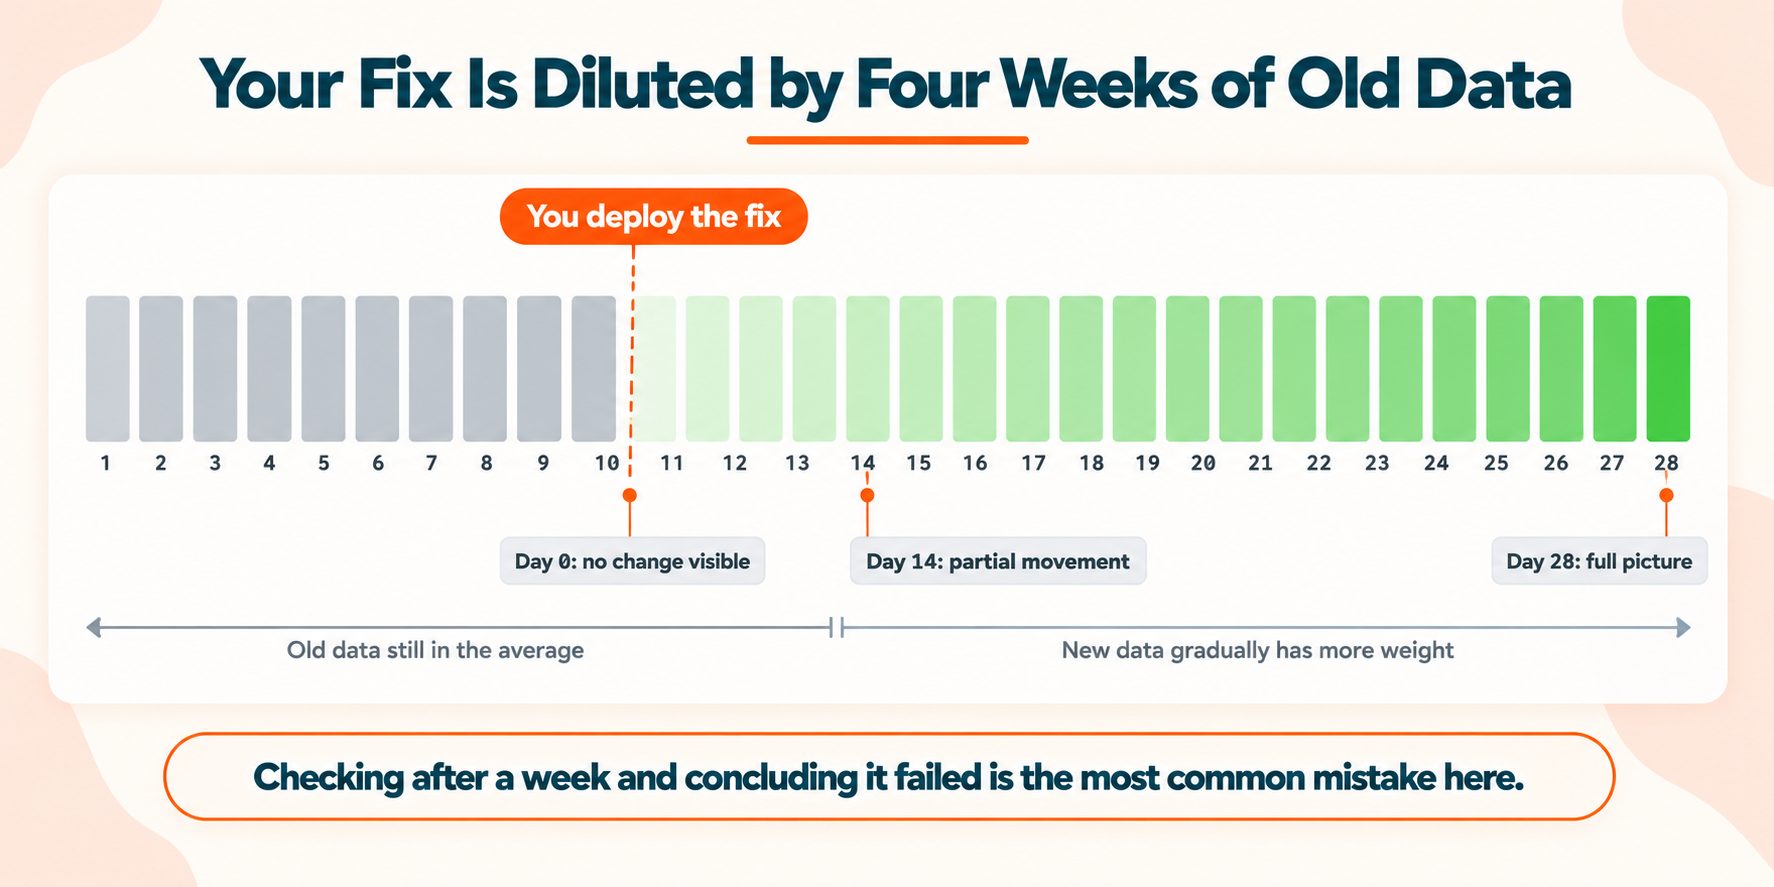
A 28-day rolling window. Changes take about a month to show up. This is the single most common reason people think a fix did not work.
The rest of this guide is about the diagnosis rather than the numbers.
Largest Contentful Paint (LCP)
The metric most sites fail, and the one with the most diagnostic detail available.
What it measures
The render time of the largest image or text block visible in the viewport. Good under 2.5 seconds.
What counts as an LCP candidate: images, video poster frames, background images loaded through url(), and block-level elements containing text. The element can change during load, since something larger may render later, so LCP is only finalised when the user interacts or the page finishes loading.
Finding your LCP element
This is the step almost every guide skips, and nothing downstream works without it.
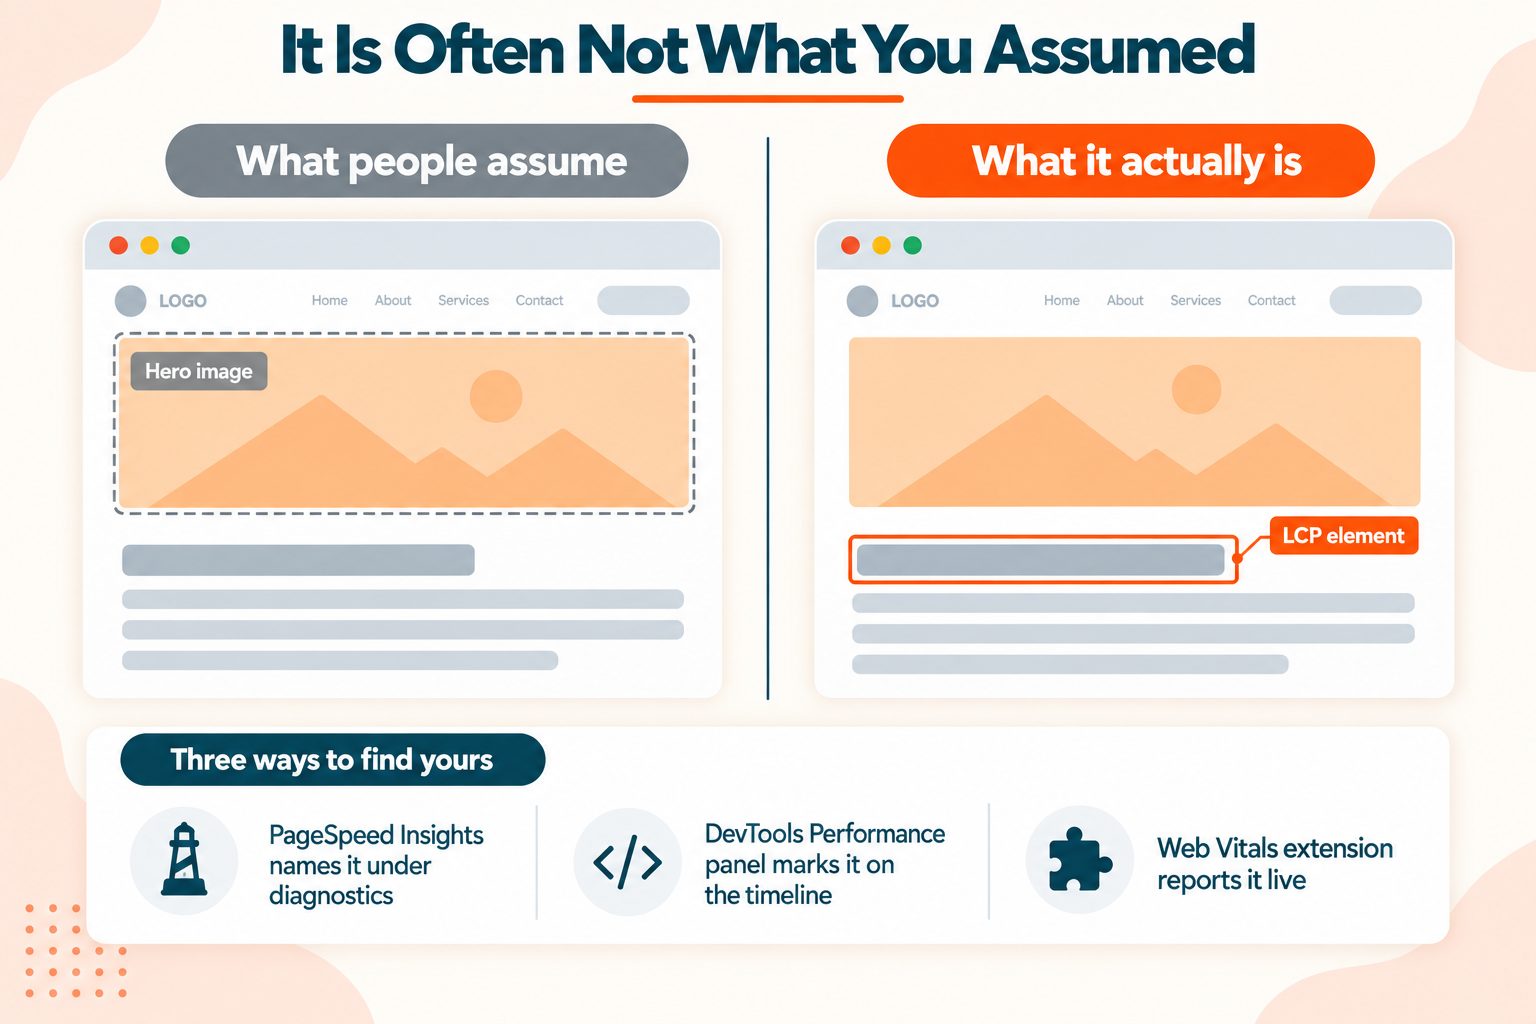
PageSpeed Insights names it. Under the diagnostics, there is an entry for the Largest Contentful Paint element with the exact selector.
Chrome DevTools marks it. In the Performance panel, record a page load and look for the LCP marker on the timeline. Hovering it highlights the element on the page.
The Web Vitals extension reports it live as you browse, which is useful for checking pages you have not instrumented.
It is frequently not the element you assumed. On plenty of pages the LCP turns out to be a heading rather than the hero image, or a background image nobody thought of as content.
The four sub-parts
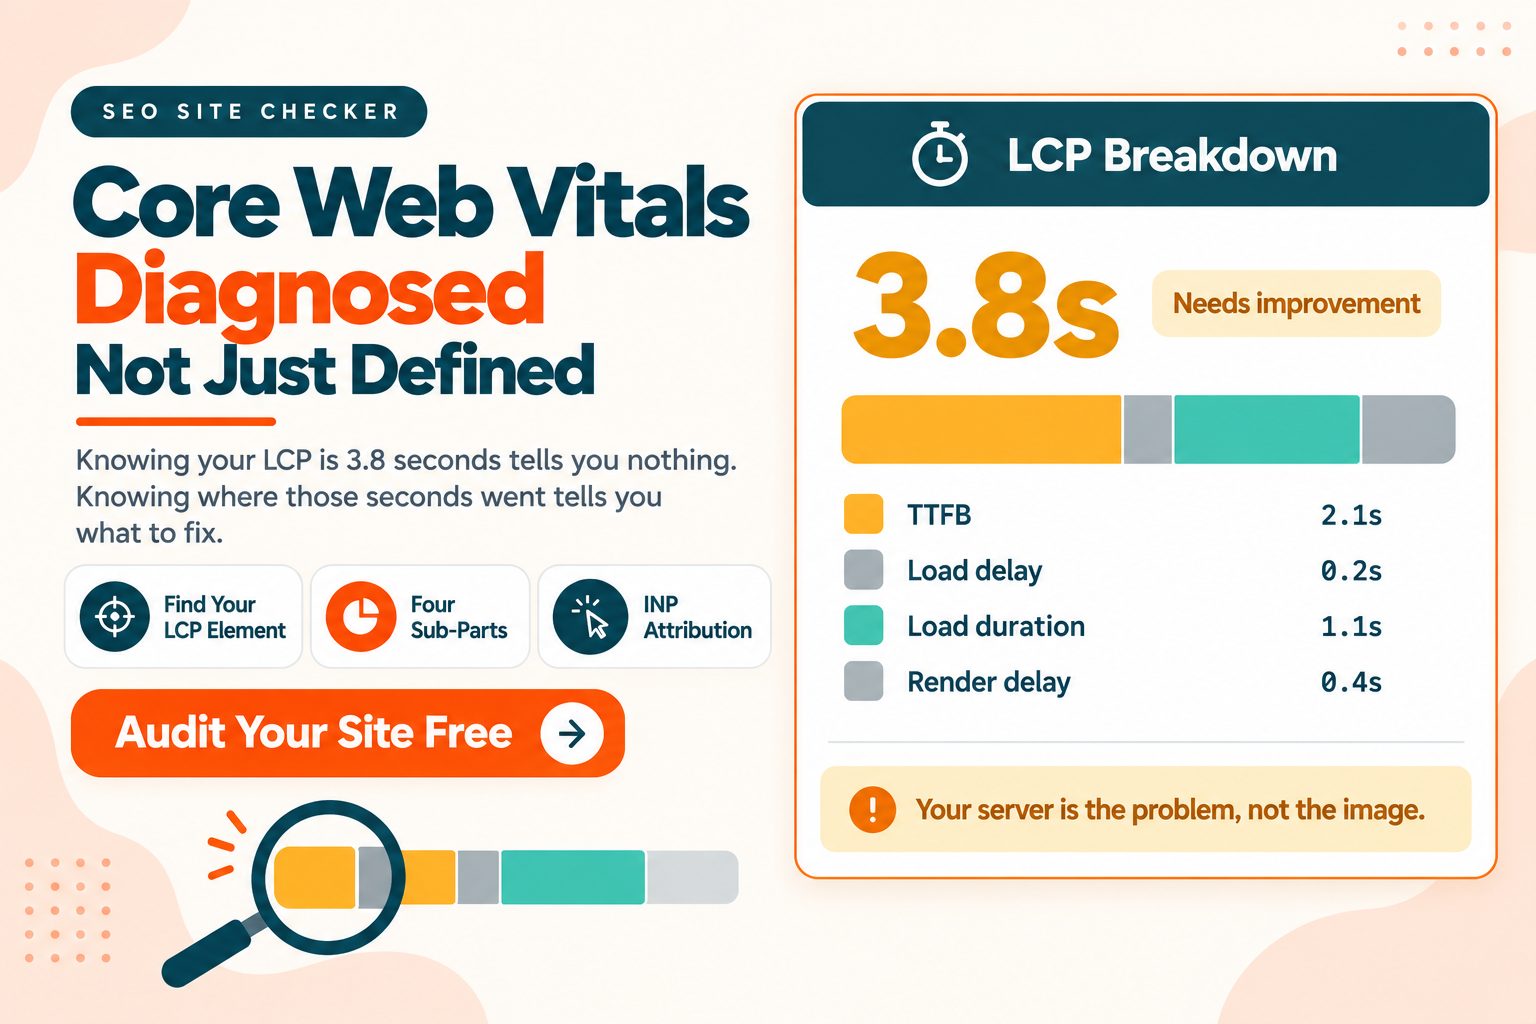
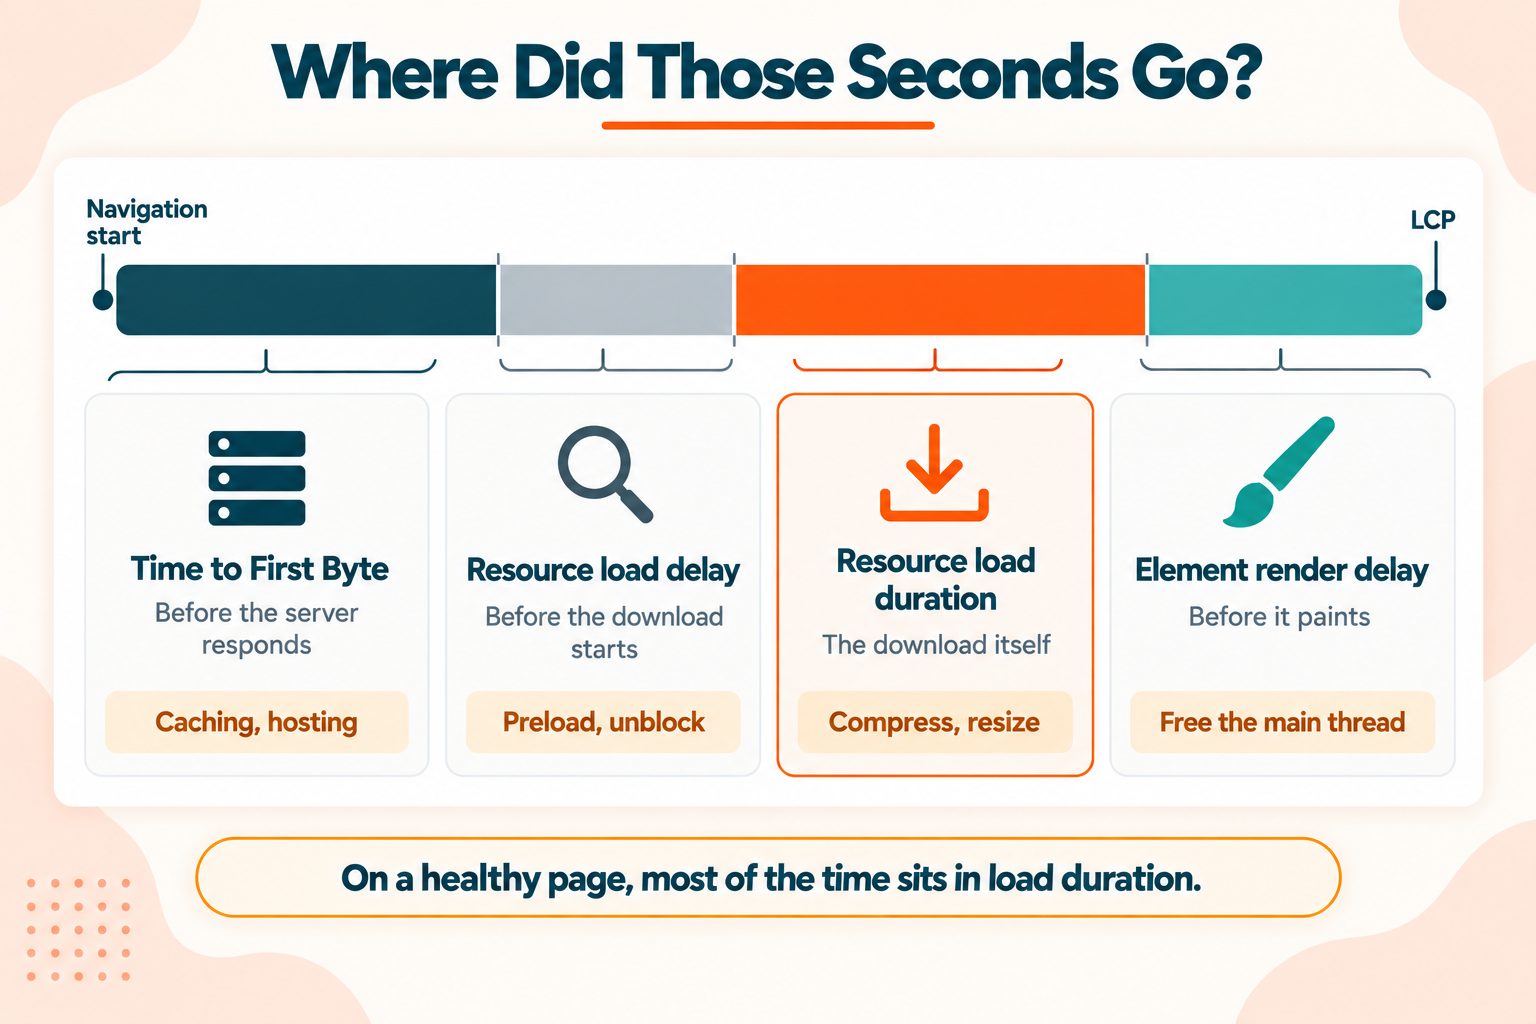
Knowing your LCP is 3.8 seconds tells you there is a problem. Knowing where those 3.8 seconds went tells you what to fix.
Google's guidance splits LCP into four phases:
| Sub-part | What it is | Where to look |
|---|---|---|
| Time to First Byte | How long before the server responds | Hosting, caching, database queries |
| Resource load delay | The gap between TTFB and the resource starting to download | Discovery, preload, render-blocking resources |
| Resource load duration | The download itself | File size, format, compression, CDN |
| Element render delay | The gap between download finishing and the element painting | Main thread blocking, CSS, JavaScript |
The useful rule of thumb: on a well-optimised page, most of the time sits in load duration, with TTFB and render delay both small. Load delay should be close to zero.
So the diagnosis follows directly:
- TTFB dominates? Your problem is the server, and nothing you do to the image will fix it
- Load delay dominates? The browser found the resource late. Preload it, or remove whatever is blocking discovery
- Load duration dominates? The file is too big. This is the good case, and the easiest to fix
- Render delay dominates? Something is occupying the main thread when the image is ready to paint
Google's guidance on optimizing LCP covers the breakdown in full and is worth reading once properly.
Fixing it
Ordered by which sub-part dominates rather than as a generic checklist.
For TTFB: server-side caching, better hosting, database query optimisation, a CDN. Check the number first with a server response test, since anything over about 600ms is worth attention before you touch anything else.
For load delay: add fetchpriority="high" to your LCP image, preload it, and remove render-blocking CSS and JavaScript from the head. Never lazy-load anything above the fold, which is a surprisingly common own goal.
For load duration: compress the image, resize it to the dimensions it actually displays at, and serve a modern format.
For render delay: reduce main-thread work, and minify your CSS so stylesheets parse faster.
Interaction to Next Paint (INP)
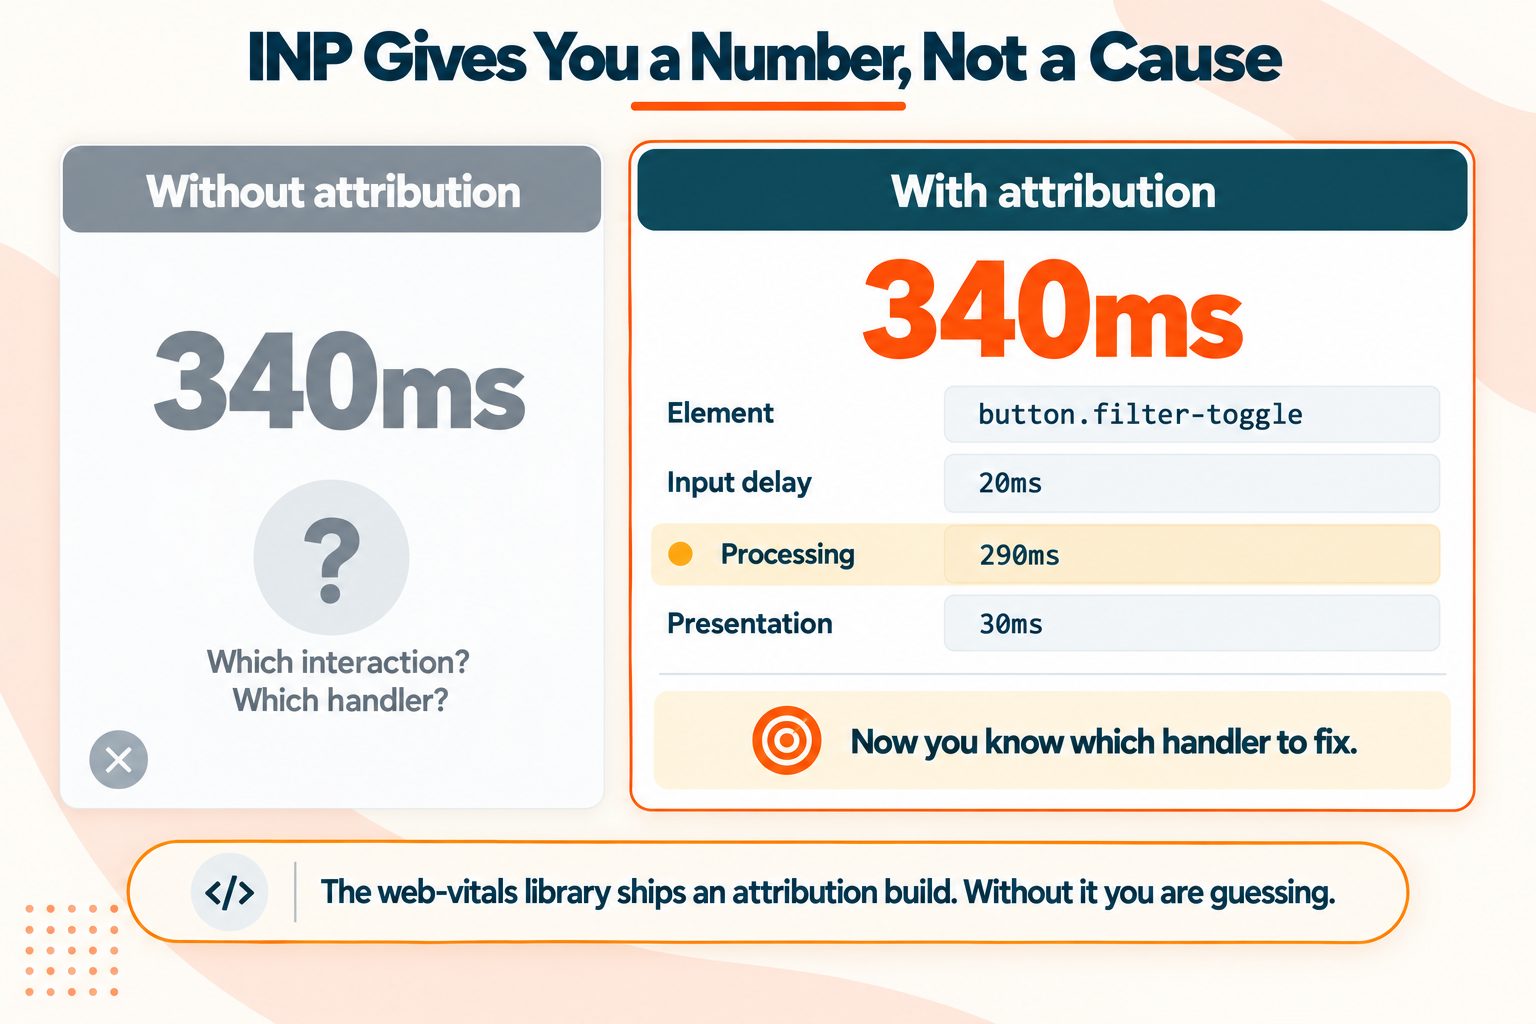
The hardest of the three, because the metric gives you a number without telling you what caused it.
What it measures
The latency of interactions across the entire visit, reported at roughly the worst one. Good under 200 milliseconds.
It replaced First Input Delay in March 2024, and the change matters more than a rename. FID measured only the delay before the first interaction was processed. INP measures the full time from interaction to visual feedback, for every interaction on the page. Plenty of sites that passed FID comfortably fail INP, and nothing about those sites changed.
The three phases
Every interaction breaks into three parts:
Input delay. The time before your handler runs, usually because the main thread is busy with something else.
Processing time. Your event handlers actually executing. This is where most INP failures live.
Presentation delay. The time between your handler finishing and the browser painting the result.
Finding the slow interaction
This is where INP differs from the other two. LCP points at an element. CLS points at shifting content. INP points at nothing.
The fix is attribution. The web-vitals library ships an attribution build that reports which element was interacted with, which of the three phases dominated, and the longest script involved. Without it, you are guessing which of your handlers is the problem, on a page that might have fifty.
The Web Vitals Chrome extension also surfaces attribution data as you interact with a page, which is the quickest way to check a specific interaction you suspect.
web.dev's reference on INP covers the attribution approach in detail.
Fixing it
Break up long tasks. Anything occupying the main thread for more than 50ms blocks interaction. Split the work.
Yield to the main thread. Let the browser handle pending interactions between chunks of work rather than after all of it.
Defer non-urgent work. Analytics, logging and state updates that nobody is waiting for do not need to run inside the handler.
Audit third-party scripts. Chat widgets, A/B testing tools and tag managers are frequent culprits, and each one seemed small when it was added.
Avoid large DOM updates inside handlers. Recalculating layout for a thousand elements on click is a guaranteed INP failure.
Worth saying plainly: no caching plugin fixes INP. Caching helps TTFB and repeat visits. INP is about what your JavaScript does after the page has loaded, and that is an architectural problem rather than a configuration one. Minifying your JavaScript reduces parse time and helps at the margin, but it does not change what your handlers do.
Cumulative Layout Shift (CLS)
The easiest of the three to fix, which makes it the right place to start if you are failing more than one.
What it measures
The largest burst of unexpected layout shifts during the page's lifetime. Good under 0.1.
Two details that most guides omit and that change how you read your score:
CLS is not a running total. It is the worst session window, meaning the highest-scoring group of shifts occurring within a five-second window, with gaps of no more than one second between them. A page with three small shifts spread across a minute scores lower than a page with three small shifts in the same second.
Shifts within 500ms of a user interaction do not count. If content moves because someone clicked something, that is expected behaviour and it is excluded. Only unexpected shifts count.
Finding the shifts
DevTools Performance panel highlights layout shift regions on the timeline, with the affected elements listed.
PageSpeed Insights lists the shifting elements under diagnostics.
The Web Vitals extension logs shifts to the console as they happen, which is the most direct way to catch them while clicking around.
One warning. CLS often appears only on real devices with real ad loading, real font swapping and real network conditions. A clean lab score means very little here, more so than for the other two metrics.
Fixing it
In rough order of how often each one is the cause:
- Set width and height on every image and video. This alone resolves most CLS problems, because the browser reserves the space before the file arrives.
- Reserve space for ads and embeds. A container with a fixed minimum height stops the page jumping when the slot fills.
- Handle font loading.
font-display: optionalavoids the swap entirely.swapcauses a shift unless your fallback metrics are matched. - Never inject content above existing content after load. Cookie banners, promo bars and notification strips are the usual offenders.
- Use CSS
aspect-ratiofor responsive media rather than relying on dimensions alone.
Lab Data Will Not Tell You If You Pass
Briefly, because this is covered in more depth in the page speed guide. Lab data is a simulated test on one device. Field data is real Chrome users over 28 days. Only field data feeds the assessment.
The part that guide does not cover, and that causes more confusion than anything else here, is URL grouping.
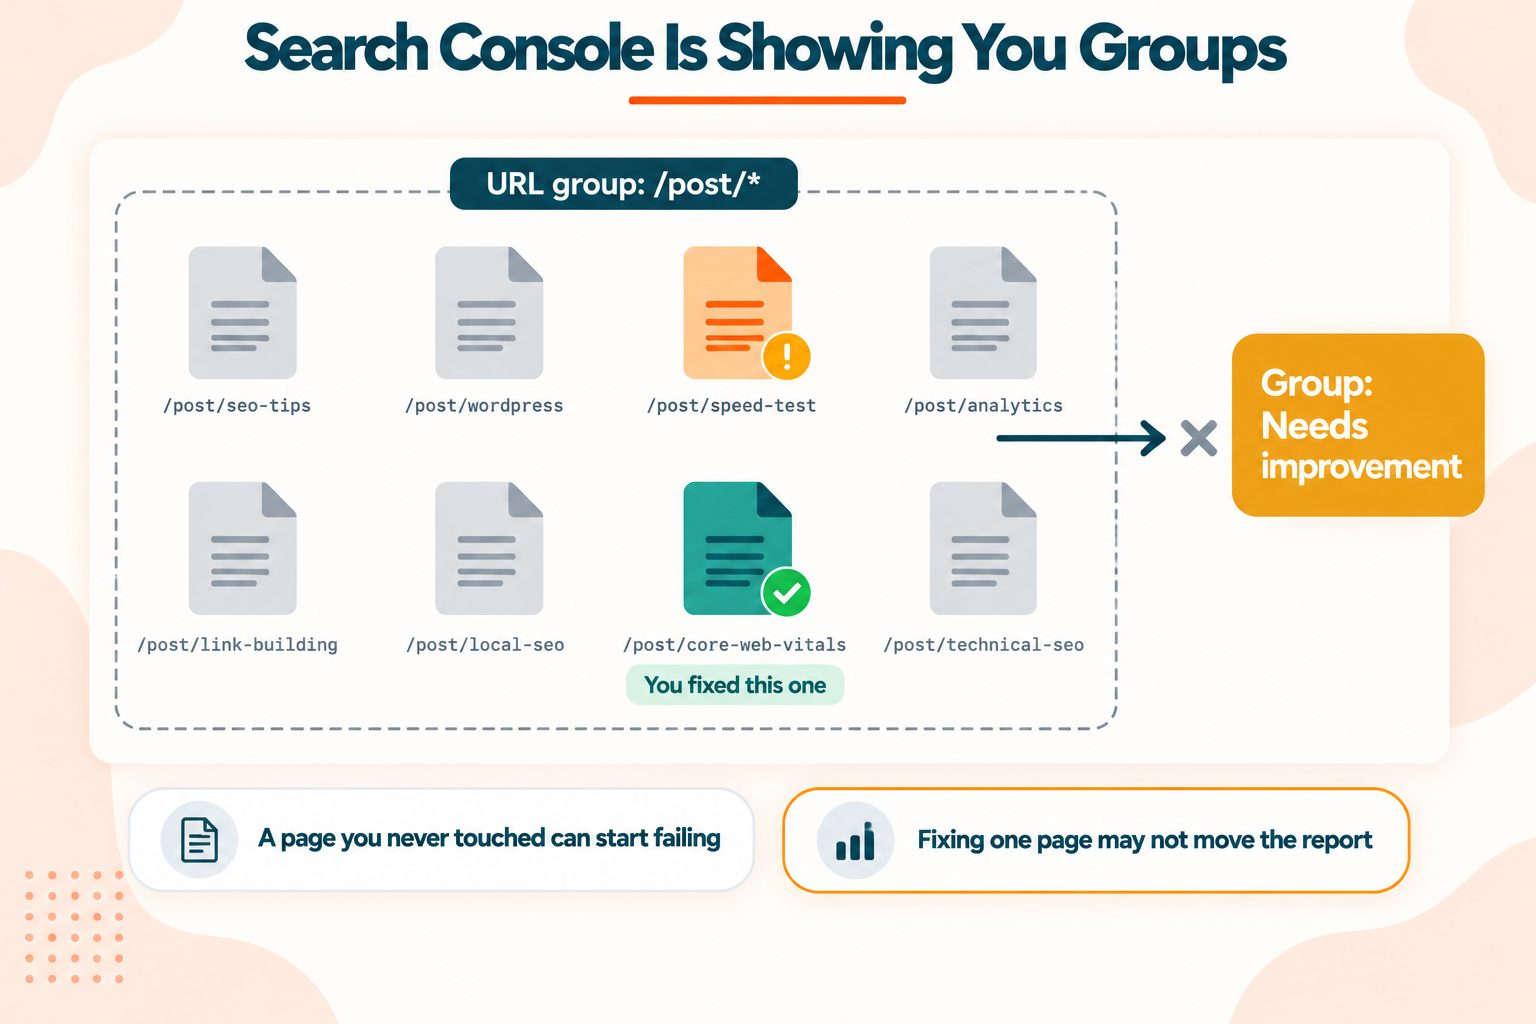
When an individual page has too little field data to be assessed on its own, Google groups it with similar URLs and reports the group's performance. Your Search Console report is showing you groups, not always individual pages.
Two consequences follow, and both surprise people:
A page you never touched can start failing. Something else in its group got slower, and the group assessment moved.
Fixing one page may not move the report. If the group contains forty posts sharing a template and you fixed one, the group barely shifts.
The practical response is to work at the template level, not the page level. If your blog post template loads a slow hero image, every post shares that problem and one template fix resolves all of them. Running a full site audit helps here, since it surfaces issues that repeat across pages rather than treating each URL in isolation.
How to Check Your Core Web Vitals
Each tool answers a different question.
Search Console, Core Web Vitals report. Field data, grouped by URL pattern, across your whole site. This is where you find out what is failing and it is the only one that reflects your actual assessment.
PageSpeed Insights. Field and lab data on one page, plus the LCP element named and specific recommendations. Run it on a representative URL from each failing group rather than defaulting to your homepage.
Chrome DevTools. Where you diagnose rather than measure. The Performance panel gives you the LCP marker, layout shift regions, and long task attribution.
Web Vitals Chrome extension. Live metrics as you browse, including LCP element identification and INP attribution. The fastest way to check a specific interaction.
CrUX dashboards. Historical field data, useful for confirming a trend rather than a single reading.
The workflow, in order: Search Console to find failing groups, PageSpeed Insights on one URL from each, DevTools to find the cause, fix, then wait about a month before checking field data again.
Why You Still Fail After Fixing Things
Four reasons, and the first accounts for most of them.
The 28-day window has not caught up. Field data is a rolling average of the last four weeks. A fix deployed today is diluted by three and a half weeks of old data. Expect partial movement at two weeks and a full picture at four.
You fixed the wrong page. URL grouping again. Check which pages are actually in the failing group before choosing where to work.
You optimised the lab number. A Lighthouse score improving while field data stays flat usually means you fixed something the simulated test measures and real users were not experiencing.
The failure is on mobile. Mobile and desktop are assessed separately, and mobile is where most sites fail, because the thresholds were calibrated around mid-range mobile hardware. A desktop pass tells you almost nothing.
One more thing worth knowing: a URL group needs a minimum volume of traffic to be assessed at all. Low-traffic pages often show no data rather than a failure, which is not a problem to fix. The HTTP Archive Web Almanac publishes aggregate data on how sites perform in the field if you want a sense of where yours sits relative to the web generally.
Core Web Vitals and Rankings, Honestly
Confirmed as part of Google's page experience signals since 2021. It works as a tiebreaker between comparable pages rather than as something that overrides relevance. Passing will not lift a thin page above a better one. The page speed guide covers that argument properly.
The point specific to optimisation work is this: the difference between bands is what counts, not the exact number.
Moving LCP from 2.6 seconds to 2.4 crosses a threshold and changes your assessment. Moving it from 1.8 to 1.6 changes nothing at all, because both are already good.
That reframes where effort goes. Find the pages sitting just outside a threshold and push them over, rather than making already-fast pages faster. A site with six pages at 2.6 seconds gains far more from six small fixes than from one heroic optimisation of a page that already passes.
Wrapping Up
The sequence that works:
- Find the failing group in Search Console rather than testing pages at random.
- Identify the specific element or interaction. Which element is your LCP, which interaction is slow, which content is shifting.
- Work out which sub-part dominates. A slow LCP caused by TTFB needs a completely different fix from one caused by an oversized image.
- Fix at the template level where you can, since URL grouping means one template fix often resolves dozens of pages.
- Then wait. Four weeks, not four days.
If you are failing more than one metric, start with CLS. It is almost always the cheapest to fix, and all three have to pass together anyway.
Frequently Asked Questions
Frequently Asked Questions (FAQs) is a list of common questions and answers provided to quickly address common concerns or inquiries.
What are Core Web Vitals?
Three metrics measuring loading, responsiveness and visual stability: Largest Contentful Paint, Interaction to Next Paint, and Cumulative Layout Shift. Google measures them from real Chrome users.
How do I pass Core Web Vitals?
All three metrics must be in the good band at the 75th percentile of real visits over 28 days. There is no partial credit.
What is a good Core Web Vitals score?
LCP under 2.5 seconds, INP under 200 milliseconds, CLS under 0.1. Anything in the middle band counts as a fail for assessment.
Are Core Web Vitals a ranking factor?
Yes, as part of page experience signals. They act as a tiebreaker between pages of comparable relevance rather than overriding content quality.
How do I check my Core Web Vitals?
Start with the Core Web Vitals report in Search Console for field data, then run PageSpeed Insights on a failing URL to find the specific cause.
Why do my Core Web Vitals fail on mobile but pass on desktop?
They are assessed separately, and the thresholds were calibrated around mid-range mobile hardware on slower connections. Mobile is where most sites fail.
How long do Core Web Vitals take to update?
Field data uses a 28-day rolling window, so allow about a month for a fix to fully appear. Partial movement shows at around two weeks.
What replaced First Input Delay?
Interaction to Next Paint replaced FID in March 2024. INP measures every interaction's full latency rather than just the first interaction's delay.
What is a good INP score?
Under 200 milliseconds. Between 200 and 500 needs improvement, and over 500 is poor. It is usually the hardest of the three to fix.
Why does a page I never changed suddenly fail?
Google groups similar URLs when individual pages lack enough field data. Another page in the group got slower and moved the whole group's assessment.