
SEO Analysis of Top Websites: The Short Answer
Quick answer: In this SEO analysis of top websites, we ran our free SEO report on 100 popular home pages from the Tranco list on November 18, 2026 UTC. It could grade 84 and not the other 16. Among ten common issues, Image Alt Text was flagged most often, on 69 of 84 (82%), and Structured Data had the widest gap, flagged 24 points more often than on everyday sites.
The post gives technical SEO statistics row by row, sets the 100 beside the everyday sites of our earlier audit and lists the checks even popular sites skip. It names no site, makes no ranking claim and holds no traffic, backlink or keyword data. The 16 sites the report could not grade are a finding too.
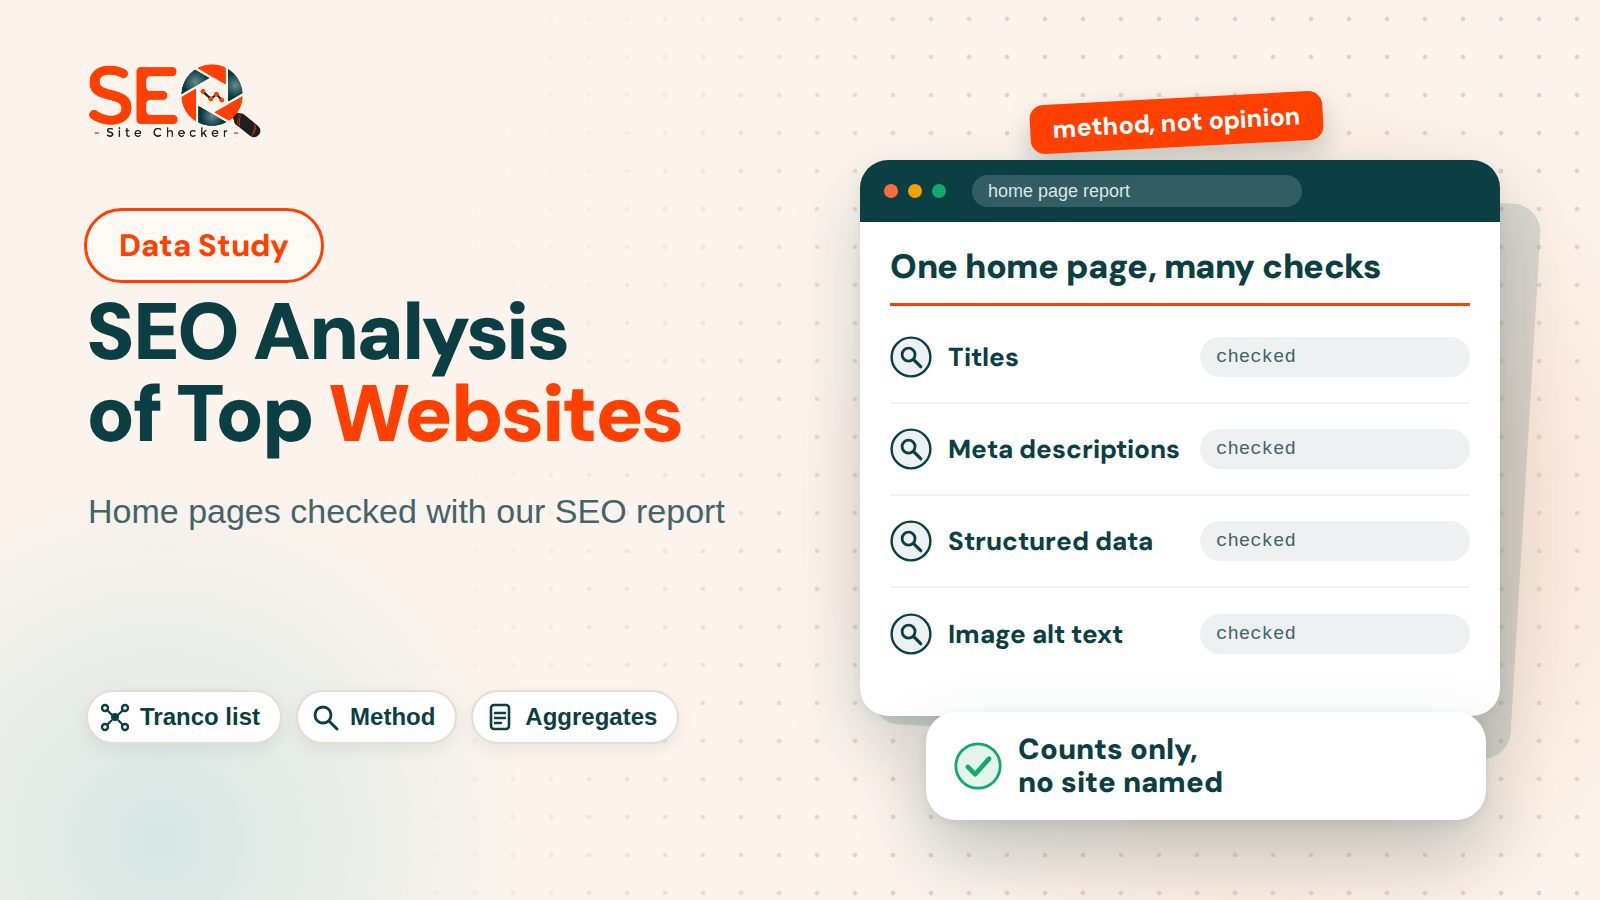
Every number in this SEO data study comes from one dated run of our own report, one home page per site.
How the 100 Websites Were Chosen From the Tranco List
Any SEO analysis of the most popular websites starts with the choice of sites, and ours is Tranco list V38GN, a research-oriented top sites ranking hardened against manipulation, as the title of its paper puts it (Le Pochat, Van Goethem, Tajalizadehkhoob, Korczyński and Joosen, NDSS 2019). V38GN combines five source rankings from October 19, 2026 to November 17, 2026, a span of 30 days, with the Dowdall rule. It keeps pay-level domain names only and was first generated on November 17, 2026. Popular here means high in those combined rankings, not high in Google Search.
We walked the list from rank 1 in order and kept a domain if it is a consumer or business website. We dropped it if it only provides infrastructure (content delivery, DNS, API, software update, tracking and ad hosts, tenant login domains) or if it is an alias that redirects to another listed site, because two names for one site count once. That frame rule is a judgment applied by hand, so we publish the rule and the counts.
- Examined: ranks 1 to 232, so the 100th site we kept sits at Tranco rank 232.
- Kept: 100 websites.
- Dropped: 132, of which 113 were infrastructure or tenant login domains, 17 were aliases and 2 were not working sites, one shut down and one a placeholder page.
The sample frame is not limited to the US, because the list has no country filter. These 100 are neither a random sample of the web nor the 100 largest companies. We publish no list of the 100 domains and no per site result, only aggregate counts, while the Tranco list is public, so anyone can see the order.
For a reproducible method, take the list, apply the rule and run the free report on each home page, one at a time. We did exactly that for this SEO study; the 100 audits were not saved as reports on our site, so none of them appears in the reports list.
What Our SEO Report Checks on a Home Page, and What It Cannot See
This SEO audit of top websites runs the same report as the free checker: a headless Chromium load of the address, about 68 scored rows (67 to 69, depending on the page) and 10 AI readiness rows that this post does not count. It is an on-page SEO analysis of the served HTML plus a few extra requests, and each row ends Passed, Warning or Failed. We ran it once per site, one at a time, between 01:42 and 04:00 UTC from one server location. See finished reports for what one looks like and how the score is calculated for the formula.
Flagged versus failed: flagged means a row ended Failed or Warning, failed means Failed only, and a site counts once for each issue. The two canonical rows, Meta Canonical and URL Canonicalization, are really one test, so together they make one issue. Rows that always pass are not ranked: Nofollow Attribute is an informational row and the three keyword tables always pass.
Three limits shape every number below.
- Separate requests. Several rows make their own request or connection from our server, not through the browser, with a 3 second timeout: Custom 404 Error Pages, robots.txt, Sitemaps, ads.txt, Google Site Verification, In-page Links, HSTS (the Strict-Transport-Security header), Server Signature, the SSL certificate check and the HTTP2 Test. They read a status code, a header or a handshake, so a web application firewall that answers our server with a 403, a challenge or a dropped connection can cause a false positive. They ask for the domain as the list gives it, which for some sites is a bare name that redirects, and a HEAD row such as HSTS reads that redirect answer.
- Lab data. Speed rows are one load measuring Total Blocking Time, Largest Contentful Paint, First Contentful Paint and Cumulative Layout Shift, with no Interaction to Next Paint and no field data, so Core Web Vitals are covered only partly.
- One page. A home page SEO audit cannot see home page versus inner pages, duplicate content, thin content, search intent, keyword targeting, backlinks or real mobile use.
A walkthrough of one report shows a finished report.
What We Could Not Read: Bot Protection, Errors and Sites That Would Not Load
Of the 100 sites audited, 84 were graded, 15 showed a bot protection, verification or access denied page that the report cannot grade, and 1 returned no usable result because the audit timed out. The report detects such a bot challenge page and says so. It does not try to solve or get around it.
| Outcome | Sites | Share of the 100 |
|---|---|---|
| Graded | 84 | 84% |
| Bot protection or access page | 15 | 15% |
| No result, the audit timed out | 1 | 1% |
A bot protection page is not the site, so none of the 68 rows is counted for it, and it says nothing about crawler access for Googlebot. Google's page on verifying requests from Google crawlers describes how an owner can verify Googlebot: a reverse DNS lookup of the visiting address that must name one of Google's own crawler domains, then a forward lookup that returns the same address, or a match against Google's published IP ranges. So a firewall can challenge an unknown tool and still serve Google. We do not say any audited site blocks Googlebot, and the run stored only a yes or no, so we cannot say which protection product any site uses.
In the November 16 run of our earlier audit, 9 of 347 addresses (3%) showed a bot protection page, and 62 gave no result, 50 of them because the domain no longer resolves. Here 15 of 100 (15%) did, a larger share of bot protection pages, while only 1 gave no result. The detector gained a browser verification rule on November 17, so the shares are not strictly like for like. For a site behind such a page, a human check or Google Search Console is the right second step.
SEO Statistics From 100 Popular Websites: The Table
This table of website SEO statistics ranks the ten issues of 10 most common SEO issues found during site checks by the share of sites, among the 84 graded top sites, on which the issue was flagged, highest first. The last column sets that share beside the everyday sites of that post, 276 graded sites that visitors or our own team ran through the free tool (so not a picture of large sites), run through the same report on November 16, 2026.
| Issue (report row) | Top 100 flagged | Top 100 failed | Everyday sites flagged | Gap in points |
|---|---|---|---|---|
| Image Alt Text | 69 of 84 (82%) | 0 of 84 (0%) | 59% | 23 points higher |
| Headings | 40 of 84 (48%) | 40 of 84 (48%) | 26% | 22 points higher |
| Structured Data | 40 of 84 (48%) | 40 of 84 (48%) | 24% | 24 points higher |
| robots.txt and sitemap: robots.txt, Sitemaps (separate request) | 36 of 84 (43%) | 30 of 84 (36%) | 24% | 19 points higher |
| Meta Description | 35 of 84 (42%) | 15 of 84 (18%) | 42% | about the same |
| Soft 404 pages: Custom 404 Error Pages (separate request) | 33 of 84 (39%) | 29 of 84 (35%) | 28% | somewhat higher, within what a sample this size can move |
| Slow loading: Largest Contentful Paint Test, Load time | 31 of 84 (37%) | 17 of 84 (20%) | 29% | about the same |
| Title | 29 of 84 (35%) | 2 of 84 (2%) | 25% | not compared |
| Canonical tag: Meta Canonical, URL Canonicalization | 21 of 84 (25%) | 20 of 84 (24%) | 20% | about the same |
| Favicon | 8 of 84 (10%) | 8 of 84 (10%) | 11% | about the same |
Counts of graded sites, one page per site; a site can appear in many rows.
The graded top sites have a median score of 71.0 (25th to 75th percentile 65.2 to 73.9, highest 81.16) and the everyday sites 72.1 (66.7 to 76.8, highest 86.96). The top 100 median sits inside the everyday range, so we call the SEO score of popular websites about the same.
Outside the ten issues, popular sites were flagged far more often on one lab row: Total Blocking Time Test, on 56 of 84 (67%) against 18% of everyday sites, 49 points higher, the widest gap that runs in that direction. Console Errors was the next browser row, on 53 of 84 (63%) against 29%. Total Blocking Time passes at 0.2 seconds or less and fails above 1 second.
Our rules are stricter than Google's in four places: Headings wants exactly one H1, Title passes a title tag of 10 to 70 characters, Meta Description passes at 50 to 160 and Image Alt Text counts an empty alt as missing. The Title row reads not compared because its rule changed on November 17, 2026, after the everyday run: an SVG icon's title no longer counts as a second title. Left out are In-page Links (25 of 84, 30%), the rows that always pass and any row measured on fewer than 30 sites.
Where Popular Websites Are Ahead, and Where They Are Not
We picked rows by one rule: flagged at least 15 points less often than on everyday sites, leaving out rows that always pass, the HTTPS row, which passes because we typed https://, and rows that ask the home domain for a file or header. Four rows meet it, and none concerns whether Google can read the page. The largest gap, Plaintext Email, flagged on 5 of 84 (6%) against 54%, gets no heading below: it passes when a home page prints no email address in its text, which says nothing about effort.
CDN Usage Test
This row counts every image, script, link tag, frame and media file in the page whose host name differs from the address we typed. It passes when 70% or more come from another host name, warns from 40% and fails below that. It reads host names, not delivery networks. It was flagged on 26 of 84 (31%) against 64% of everyday sites, 33 points lower. Read that as how files are hosted, not as better search practice.
SPF Records
This row asks DNS for the TXT records of the typed domain and passes when one starts with v=spf, the record that lists which servers may send email for the domain. It is about email delivery, not search. It failed on 2 of 84 (2%) against 22% of everyday sites, 20 points lower.
CSS Minification
This row fetches up to the first 8 stylesheet files itself, with a plain HTTP client and a 3 second timeout, and calls a file minified when its average line runs past 200 characters. It passes when every fetched file looks minified, warns when they differ and fails when none does. It was flagged on 50 of 84 (60%) against 75%, 15 points lower. It is a separate request, and a blocked fetch counts as not minified, so a firewall can raise this flag.
On page content rows the picture reverses: Image Alt Text, Headings and Structured Data were flagged 22 to 24 points more often among the popular sites. The report cannot see why.
What Even Popular Websites Skip
Three of the ten issues stand out, and some rows are flagged even more often without being about crawling or indexing.
Image Alt Text
Flagged on 69 of 84 (82%), every flag a warning, since this row never fails. An img tag whose alt is absent, empty or blank counts as missing, so a decorative image with a correct empty alt counts too. Everyday sites were at 59%, which makes the popular sites 23 points higher.
Headings
Flagged on 40 of 84 (48%), all fails. The row passes with exactly one H1 and fails with no H1 or with several, and it ignores the rest of the heading structure. That is our rule, not Google's. Everyday sites were at 26%, which makes the popular sites 22 points higher.
Structured Data
Also 40 of 84 (48%), all fails. The row passes when the home page holds JSON-LD or microdata and every JSON-LD block is valid JSON, and it fails when the page holds none it can read. It does not test whether the properties fit the schema.org type. Everyday sites were at 24%, which makes the popular sites 24 points higher.
Rows about sharing, speed, server settings and ownership proof, not crawling or indexing, are flagged on most popular sites and most everyday sites alike:
- Social Media Meta Tags: 83 of 84 (99%) against 96%. It wants 11 Open Graph and social card tags, so one site passed.
- Inline CSS: 78 of 84 (93%) against 95%. It warns on any style attribute.
- Defer Javascript: 77 of 84 (92%) against 93%. It passes only when each of the first 8 script files is deferred or async, and it fetches each itself, so a blocked fetch counts as not deferred.
- Google Site Verification: 71 of 84 (85%) against 71%, a separate request. It reads one meta tag, while Search Console accepts other proofs of ownership.
- Server Signature: 67 of 84 (80%) against 96%, a separate request. It warns if the server sends any Server header.
- Render Blocking Resources Test: 59 of 84 (70%) against 83%. It warns when the browser reports a blocking resource.
For comparison, Google's technical requirements, a Google Search Central page last updated December 18, 2025, say a page is eligible to be indexed when "Googlebot isn't blocked", Google receives an "HTTP 200 (success) status code" and the page has "indexable content". Most report rows are not on that list, so a flagged row is a to-do item, not a verdict.
What These Numbers Do Not Tell You
- The 100 sites were picked from one ranking by a written frame rule, so they are not a sample of the web.
- Each site got one home page load, from one server location, on one day, and lab speed rows move between runs.
- The report grades the page it was served, which can be a regional or logged out version, or a block page our detector did not recognize.
- A gap under 15 points is within what a sample size like this can move and is not a finding, and one site is about 1.2 points of the 84 graded.
- The two groups were audited on different days, and the report changed in between: the Title row, which can only lift a score a little, and the bot page detector.
- The report does not measure traffic, backlinks, keyword rankings, content quality or user experience, so a pass or a fail says nothing about how a site ranks.
Popularity versus ranking: the Tranco home page says the popularity rankings it improves upon "disagree on which domains are most popular, can change significantly on a daily basis and can be manipulated", and neither those lists nor Tranco is a Google Search ranking. A high or low score here is our report's number, not Google's, and 15 points is our rule of thumb, not a statistical test.
Anyone can repeat this SEO analysis of top websites with the method above, but a different tool, day or location will give different numbers.
How to Use These SEO Statistics on Your Own Site
To compare with other sites, run the same report on your own home page. Each run audits a single page, needs no account and can give different numbers, so compare rows and not only the total.
- Skip the shared noise. Ignore rows flagged on most popular sites and most everyday sites alike, such as Social Media Meta Tags, Server Signature and Inline CSS, unless they are on your own to-do list. How to read a failed or warning row explains severity.
- Prioritize fixes in the search rows. Start with Title, Meta Description, Headings, the canonical rows, Structured Data, Image Alt Text and the 404 answer. The three rows where popular sites were ahead are about hosting, email and file size, so they can wait. What to fix first gives the order in which to fix SEO issues.
- Recheck after changes. Keep the number and the date before and after, because a new scan replaces the stored report.
Google Search Console is the place for real indexing and crawl data, which a one page report cannot see.
Frequently Asked Questions
Frequently Asked Questions (FAQs) is a list of common questions and answers provided to quickly address common concerns or inquiries.
What is the Tranco list and why use it for a study of popular websites?
Tranco is a research ranking of the most popular domains, designed to improve agreement on popularity and stability over time and, as its paper's title says, hardened against manipulation. List V38GN combines five source rankings over 30 days with the Dowdall rule and keeps pay-level domains only. It ranks domains, not pages, so we applied a written rule to drop infrastructure and alias domains.
Do the most popular websites have perfect SEO?
No. None of the 84 graded sites had zero Failed rows, so every one failed at least one check. A report averaged 47.8 passed, 10.3 failed and 10.8 warnings, with a median score of 71.0 and a highest score of 81.16. The report grades one home page and says nothing about rankings.
Why did some of the top 100 websites return no result?
Of the 100 audits, 16 gave no graded result: 15 showed a bot protection or access page and 1 timed out. A bot protection page is not the site, so the report grades nothing for it and does not try to get around it. That does not mean the site blocks Google, because owners can verify Googlebot by reverse DNS or published IP ranges.
Which SEO checks do the most popular websites skip most often?
Among the ten common issues, Image Alt Text was flagged on 69 of 84 sites (82%), then Headings on 40 of 84 (48%) and Structured Data on 40 of 84 (48%). Rows such as Social Media Meta Tags, on 83 of 84 (99%), are flagged even more often but say little about crawling or indexing. A flagged row is a to-do item, not a verdict.
Does a high SEO score mean a site ranks higher in Google?
No. The score is our report's number from about 68 checks on one page, not a Google measure and not a ranking signal we can point to. Google's technical requirements say a page is eligible for indexing when Googlebot is not blocked, it returns HTTP 200 and it has indexable content, and even then indexing is not certain.
Can I run the same report on my own site and compare it with these numbers?
Yes. The free Website SEO Score Checker takes one URL at a time, asks for no account and usually finishes in well under a minute. Compare row by row, not only the total, because lab speed rows move between runs and a new scan replaces the stored report. One home page is not comparable with a group of 100.
Is this an analysis of US websites only?
No. This SEO analysis of top websites uses a Tranco list with no country filter, so the sample is not limited to the US, and the report ran from one server location. That is why the title does not say US. We chose sites by walking the list in order and keeping consumer and business websites, not at random.